
DIRTT Announces Record Q4 and 2016 Annual Results


DIRTT Environmental Solutions Ltd. (“DIRTT” or the “Company”) (TSX: DRT), a leading technology-enabled designer, manufacturer and installer of fully customized, prefabricated interiors, today announced its financial results for the three- and 12-month periods ended December 31, 2016. This news release contains references to Canadian dollars and United States dollars. Canadian dollars are referred to as “$” and United States dollars are referred to as “US$”.
Selected Highlights
For the three- and 12-month periods ended December 31, 2016 the Company reported:
Q4 2016
- Record revenue of $78.3 million, an increase of $13.3 million or 20.5% over Q4 2015;
- Gross profit increased by $5.5 million, or 19.3% over Q4 2015, to $33.9 million;
- Gross profit % of 43.3% and adjusted gross profit of 44.4% for the quarter;
- Adjusted EBITDA of $11.2 million and adjusted EBITDA % of 14.4%;
- Net income of $4.3 million and net income per share of $0.06; and
- Subsequent to quarter end, announcement of a normal course issuer bid.
Fiscal 2016
- Record revenue of $267.0 million, an increase of $30.4 million or 12.8% over 2015;
- Gross profit increased by $14.8 million, or 14.6% over 2015, to $116.3 million;
- Gross profit % of 43.5% and adjusted gross profit of 44.7%;
- Adjusted EBITDA of $31.3 million and Adjusted EBITDA % of 11.7%;
- Net income of $7.3 million and net income per share of $0.09;
- Year-over-year revenue growth of 27.9% for initial class of DIRTT Movers;
- Sales and marketing and business development head count increased by 13.7% over 2015 to 108;
- Increased Distribution Partner investment in Green Learning Centers (“GLCs”) of 15.0% over 2015;
- Record attendance at DIRTT Connext, our largest sales, marketing and training initiative;
- The launch of ICEreality®, technology allowing the user to seamlessly overlay virtual world and real world elements; and
- The opening of our first GLC in London, England.
“DIRTT offers our clients a completely different construction experience than they have likely ever lived through before,” comments DIRTT CEO Mogens Smed. “Our fourth quarter and year-end results are evidence that a growing list of clients and partners are understanding how our technologies address many of the challenges of conventional construction such as project delays, inconsistent quality, cost overruns and inflexibility for future changes.”
DIRTT President Scott Jenkins adds, “We continue to see growing momentum in most of our industry segments with the notable exception of the energy sector. Strong growth during the quarter from both new and an expanding list of repeat customers is expected to continue throughout 2017. We continue to see strong traction in the healthcare and education industries, which we attribute to our unparalleled ability to build complex environments with integrated technology, on rapid timelines and with cost certainty.”
Smed continued, “While we experienced a downturn in profitability, 2016 was a year of great investment for us as we added to our sales and marketing teams, accelerated efforts from our product development team and continued to push the technology envelope forward with ICE. Announcements such as Leaf® and ICEreality® highlight some of the earlier success of our key growth strategies. Our dedicated team of DIRTTbags and ICEcubes have never been more excited about achieving our goal of truly disrupting the construction industry.”
Revenue
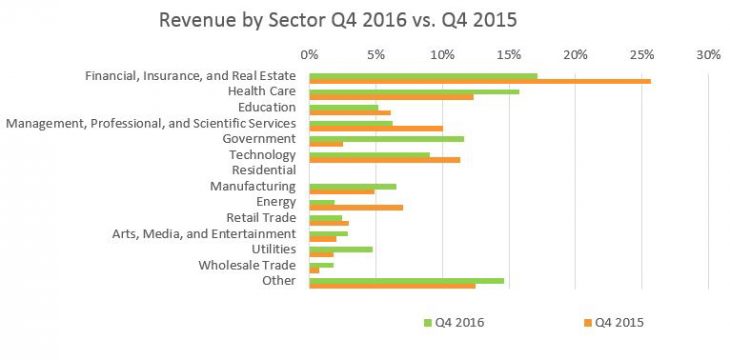
Revenue increased by $13.3 million, or 20.5%, for Q4 2016 compared with Q4 2015. This increase was achieved despite continued challenges in the energy sector, previously our largest industry segment, which declined as a percentage of revenue from 7% in 2015 to only 2% in the current period. This decrease was more than offset by a general increase in activity from small and medium-sized projects across a diverse range of industry segments including healthcare, which increased from 12% in Q4 2015 to 16% of revenue in Q4 2016; and government, which increased from 3% in Q4 2015 to 12% of revenue in Q4 2016. In addition, installations revenue in Q4 2016 increased by $2.2 million to $2.7 million, compared with $0.5 million in Q4 2015. The impact to the Canadian dollar value of US revenue on a year-over-year basis was negligible as the average US dollar exchange rate was essentially flat, decreasing from 1.3352 in Q4 2015 to 1.3344 in Q4 2016.
Below is a breakdown of percentage revenue by sector for Q4 2016 versus Q4 2015:
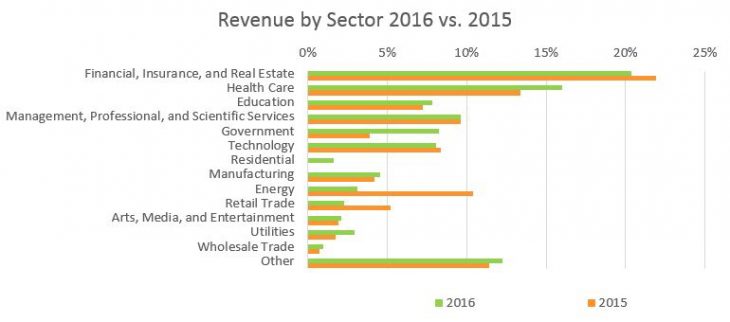
Revenue increased by $30.4 million, or 12.8%, for 2016 compared with the same period in 2015. The 2015 period included revenue of $8.6 million (3.2% of total revenue) from the previously announced US$30.0 million US energy sector contract, compared to nil during 2016. This business was partially offset by the $4.3 million contribution (1.6% of total revenue) from the residential sector during 2016. The 2016 period reflects ongoing challenges in the energy sector, with revenue contribution from this segment declining from 10% of revenue in 2015 versus only 3% of revenue in 2016. These declines were more than offset by a general increase in activity from small and medium-sized projects, from a diverse range of industry segments. The stronger average US dollar versus the comparable period in 2015 (2016 – 1.3245; 2015 – 1.2785) also increased the Canadian dollar value of US revenue which contributed to the higher revenue in 2016.
Below is a breakdown of percentage revenue by sector for 2016 versus 2015:
Gross Profit / Adjusted Gross Profit / Gross Profit % / Adjusted Gross Profit %
Gross profit for Q4 2016 improved to $33.9 million from $28.4 million in Q4 2015, an increase of 19.3%. This increase was achieved despite a slight decline in gross profit % which declined by 50 basis points to 43.3% from 43.8%. The decrease in gross profit % was due primarily to changes in product/service revenue mix, greater volatility in the timing of monthly production volumes, and a higher level of installations revenue which typically brings a lower gross profit than our standard manufacturing process.
Adjusted gross profit for Q4 2016 improved to $34.8 million from $29.3 million for Q4 2015, an increase of 18.5%. However, adjusted gross profit % declined by 70 basis points to 44.4% from 45.1% for the same reasons discussed above with respect to gross profit.
Gross profit for 2016 improved to $116.3 million from $101.5 million in 2015, an increase of 14.6%. These results were achieved on higher revenues in the year as well as with gross profit % widening 60 basis points to 43.5% from 42.9%. Higher revenue levels, relatively steady timing of manufacturing volumes for most of 2016, combined with a diverse project mix, contributed to the increase in gross profit % in 2016.
Adjusted gross profit for 2016 improved to $119.5 million from $104.5 million in 2015, an increase of 14.3% with adjusted gross profit % widening 50 basis points to 44.7% from 44.2% for the same reasons discussed above with respect to gross profit.
The higher US dollar to Canadian dollar average exchange rate (2016 – 1.3245; 2015 – 1.2785) also contributed to increased gross profit and adjusted gross profit in 2016, as the positive impact on US dollar revenue exceeded the negative impact on US dollar-based production costs.
SG&A Expenses / Adjusted SG&A Expenses / SG&A % / Adjusted SG&A %
Selling, general and administrative (“SG&A”) % increased by 320 basis points from 32.4% to 35.6% in Q4 2016 compared with Q4 2015. SG&A expenses increased by $6.8 million, or 32.2%, for Q4 2016 compared with Q4 2015. The increase reflects DIRTT’s accelerated investment in long-term growth initiatives that were incurred in 2016. The most significant change can be attributed directly to sales-related efforts as salaries and commissions increased by $4.8 million. These costs reflect the addition of personnel focused on generating and supporting higher business volumes, and commissions on the higher revenue attained in the period. A portion of the increase in salaries and commissions during Q4 2016 was due to the non-cash one-time commission reduction of $2.9 million reported in Q4 2015. Other increases in SG&A in Q4 2016 included travel and marketing costs of $1.2 million, depreciation and amortization expense of non-manufacturing-related assets of $0.7 million, professional fees of $0.2 million, rent expense of $0.2 million, and $0.9 million in other operating expense items. These increases were partially offset by decreases in non-cash marketing promotional items of $0.7 million and stock-based compensation expense of $0.5 million. The increase in depreciation and amortization expense of non-manufacturing-related assets correlates with the increase in our investment in leasehold improvements and software and product development. The decrease in stock-based compensation expense was due to the granting of stock options in November 2016 that carried a lower Black-Scholes value than the August 2015 grant.
Adjusted SG&A % decreased slightly by 60 basis points from 31.0% to 30.4% in Q4 2016 compared with Q4 2015. Adjusted SG&A expenses increased by $3.7 million, or 18.3%, for Q4 2016 compared with Q4 2015. The reason for the increase is the same as discussed above with respect to SG&A, excluding the impact from increased non-cash depreciation and amortization of non-manufacturing-related assets, decreased stock-based compensation expense incurred in the period, and the non-cash one-time commission reduction of $2.9 million reported in Q4 2015.
SG&A % increased by 280 basis points from 36.0% to 38.8% in 2016 compared with 2015. SG&A expenses increased by $18.4 million, or 21.5%, for 2016 compared with 2015. The increase reflects DIRTT’s ongoing investment in long-term growth. The most significant changes can be attributed directly to sales and marketing-related efforts as salaries and commissions increased by $6.3 million and travel, marketing and trade show costs increased by $4.6 million, of which $1.2 million was related to DIRTT Connext, DIRTT’s largest and most important sales, marketing and training initiative which occurs every June in Chicago. The increase in salaries and commissions reflects additional personnel focused on generating and supporting higher business volumes. Other increases in SG&A in 2016 included depreciation and amortization expense of non-manufacturing-related assets of $2.8 million, software licenses and computer supplies of $1.1 million, rent expense of $0.9 million, stock-based compensation expense of $0.7 million, professional service fees of $0.6 million, and $1.4 million in other operating expense items.
Adjusted SG&A % increased by 210 basis points from 30.7% to 32.8% in 2016 compared with 2015. Adjusted SG&A expenses increased by $14.9 million, or 20.5%, for 2016 compared with 2015. The reason for the increase is the same as discussed above with respect to SG&A, excluding the impact from increased non-cash depreciation and amortization of non-manufacturing-related assets and stock-based compensation expense in the year.
The higher US dollar to Canadian dollar average exchange rate (2016 – 1.3245; 2015 – 1.2785) also contributed to the overall increase in SG&A and adjusted SG&A expenses across the organization for 2016, as certain of these expenditures are denominated in US dollars.
Adjusted EBITDA / Adjusted EBITDA %
Adjusted EBITDA increased by $1.7 million, or 17.4%, for Q4 2016 compared with Q4 2015. Adjusted EBITDA % for Q4 2016 weakened slightly by 30 basis points from 14.7% in Q4 2015 to 14.4%. The dollar increase was primarily due to higher adjusted gross profit of $5.4 million and partially offset by higher adjusted SG&A expenses of $3.7 million in Q4 2016.
Adjusted EBITDA decreased by $3.4 million, or 9.9%, for 2016 compared with 2015. Adjusted EBITDA % for 2016 weakened by 300 basis points from 14.7% in 2015 to 11.7%. The decrease in 2016 was mainly due to an increase in foreign exchange loss of $3.6 million and higher adjusted SG&A expenses of $14.9 million due to DIRTT’s accelerated investment in long-term growth initiatives, partially offset by higher adjusted gross profit of $15.0 million.
Gains or losses in foreign exchange (“FX”) are primarily the result of the period end revaluation of monetary assets and liabilities held within our Canadian companies. The largest component of these assets and liabilities is our holdings of US dollar cash and cash equivalents. The increase in foreign exchange loss of $3.6 million is the result of significant fluctuations in the CAD-US exchange rate in the year-over-year periods. During 2015, the US dollar increased by $0.22 compared to year-end 2014, resulting in a $2.8 million gain on the revaluation of these monetary assets and liabilities. Conversely, during 2016, the US dollar depreciated by $0.04 compared to year-end 2015, resulting in a $0.8 million loss being recognized. These amounts exclude any gains or losses resulting from the revaluation of our US dollar-denominated long-term debt, as these amounts have been added back in the determination of Adjusted EBITDA.
Normal Course Issuer Bid
On January 6, 2017, we announced that we had received approval from the Toronto Stock Exchange to commence a normal course issuer bid (the “NCIB”) with respect to our common shares (the “Common Shares”). The NCIB commenced on January 10, 2017 and will terminate on the earlier of January 9, 2018; the date on which we have purchased the maximum number of Common Shares permitted under the NCIB; or the date on which the NCIB is terminated. Under the NCIB, we may purchase in the normal course through the facilities of the TSX up to 7,141,021 Common Shares. As of the date hereof, we have purchased 134,056 Common Shares at a weighted average price of $6.70 per Common Share, including brokerage fees, for a total cost of $0.9 million through the NCIB.
Outlook
Construction is a major global industry and consists of building new structures, making additions and modifications to existing structures, as well as conducting maintenance, repair and leasehold improvements on existing structures. The total US construction market was US$1.2 trillion in 2016, of which US$700 billion was attributable to non-residential building and US$463 billion was attributable to residential building [Source: US Census Bureau]. This includes both new building and renovation projects. Total US non-residential and residential construction spending is forecast to grow to US$837 billion and US$541 billion, respectively, in 2020 [Source: FMI US Markets Construction Overview 2017]. We believe conventional construction activities are fraught with challenges including cost overruns, quality issues, labor shortages and time delays and increasingly organizations are looking for a better way to build out their interior spaces, whether for new buildings or renovations.
Our growth strategy consists of five key initiatives: (1) increasing penetration of existing markets by providing continued support and increased investment in programs to support our existing Distribution Partners (“DPs”) throughout North America; (2) expanding into new geographies, such as the Middle East, India, Southeast Asia and United Kingdom, by capitalizing on recent and continued investment alongside new international DPs; (3) penetrating new vertical markets such as the healthcare, education and residential sectors; (4) continuing to invest in ICE and innovative construction solutions such as Leaf, the Enzo Approach, residential interiors and timber frame construction; and (5) partnering with industry leaders to monetize innovative solutions – a recent example of which is the integration of ICE with SAP’s enterprise resource planning system (ERP) completed in January 2017.
Our previously announced programs to support our top-tier and next tier DPs, such as the DIRTT Movers Program and DIRTT GLC loan programs, in addition to increasing investment in product development and ICE development, are contributing to the momentum we are seeing in the first quarter of 2017. Highlighting the success of these investments was revenue growth of 27.9% for our 2016 DIRTT Movers. In early 2017 we kicked off the DIRTT Movers program for a new group of DPs. Furthermore, we believe our ICEreality experience, which brings augmented reality to the construction industry, will change the way people design, create, collaborate and build interiors. We believe the increasing investment our DPs are making in our business, with the addition of staff, increased investment in GLCs and their increased investment in DIRTT Connext, where their attendance was up 55% in 2016, is a strong indication of the long-term prospects for our business.
We believe DIRTT Solutions and the resulting more efficient and cost-effective construction experience are a superior alternative to conventional construction across all sectors of the construction industry, and that a continued increase in global construction activity can be expected to result in an ongoing improvement to our revenue. We plan to invest additional resources in a variety of initiatives, including continuing to develop and expand ICE and new DIRTT solutions and test projects, to pursue further opportunities in the healthcare, education, government, corporate and residential sectors of the construction industry. Our product development team has been, and we expect will continue to be, expanded to address industry-specific challenges and opportunities.
Liquidity and Capital Resources
At December 31, 2016, we had $93.6 million in cash and cash equivalents compared with $91.4 million at December 31, 2015.
At December 31, 2016, we also had access to an undrawn US$18.0 million revolving credit facility.
The full text of DIRTT’s 4Q16 earnings release, including all tables, is available at www.dirtt.net/company/news.
A replay of the company’s Mar. 9 conference call, hosted by Chief Executive Officer Mogens Smed, President Scott Jenkins, and Chief Financial Officer Derek Payne, will be available at +1 855.859.2056 by entering the passcode 72737918, from noon (ET) Thursday, Mar. 9, 2017 to midnight (ET) Thursday, Mar. 16, 2017, at http://edge.media-server.com/m/p/zv4rp6so, or on DIRTT’s website at www.dirtt.net/company/investor.
About DIRTT
DIRTT Environmental Solutions (Doing it Right This Time) uses its proprietary 3D software to design, manufacture and install fully customized prefabricated interiors. The Company’s customers in the corporate, government, education and healthcare sectors benefit from DIRTT’s precise design and costing; rapid lead times with the highest levels of customization and flexibility; and faster, cleaner construction.
DIRTT’s manufacturing facilities are in Phoenix, Savannah, Kelowna and Calgary. DIRTT’s team supports more than 100 Distribution Partners throughout North America, the Middle East and Asia. DIRTT trades on the Toronto Stock Exchange under the symbol “DRT.” For more information visit www.dirtt.net.


