
DIRTT Announces Record Q1 2017 Revenue


DIRTT Environmental Solutions Ltd. (“DIRTT” or the “Company”) (TSX: DRT), a leading technology-enabled designer, manufacturer and installer of fully customized, prefabricated interiors, today announced its financial results for the three months ended March 31, 2017. This news release contains references to Canadian dollars and United States dollars. Canadian dollars are referred to as “$” and United States dollars are referred to as “US$”.
Selected Highlights
For the three months ended March 31, 2017 the Company reported:
– Record Q1 revenue of $65.1 million, an increase of $9.1 million or 16.3% over Q1 2016;
– Trailing 12-month revenue of $276.2 million, an increase of 17.1% over the same 12-month prior period ($235.8 million);
– Gross profit increased by $2.9 million, or 12.1% over Q1 2016, to $27.0 million;
– Gross profit % of 41.5% and adjusted gross profit % of 42.9% for the quarter;
– Adjusted EBITDA of $4.0 million and adjusted EBITDA % of 6.2%;
– Net loss of $1.4 million and net loss per share of $0.02;
– Growing momentum across all industry sectors to start Q2 and as we approach the latter half of 2017;
– Contract awarded in April 2017, for the initial phase of a Fortune 100 company’s multi-location, domestic and international project; and
– Ongoing preparations for DIRTT Connext, our largest annual marketing and Partner event held in Chicago each June.
“We delivered solid top-line growth in excess of 16%, despite the fact our first quarter is traditionally our weakest,” says DIRTT CEO Mogens Smed. “Our investment in sales and marketing initiatives, product development and ICE technology is only being surpassed by our Partners’ own investments as they further DIRTT’s reach in local markets. We’re confident this accelerating investment will drive growth as 2017 unfolds.”
Comments DIRTT President Scott Jenkins, “There’s an increasing number of current and potential clients viewing DIRTT as the interior construction standard for multi-location projects. These companies, hospitals, schools and government entities recognize the value our technology-backed approach offers in delivering custom, flexible projects quickly and with cost certainty.”
Smed adds DIRTT is now focused on DIRTT Connext. The annual Partner and client-focused multi-day event, June 10 – 14, 2017 in Chicago, shows registration for the event’s Partner-specific sales, marketing and learning day at 30% ahead of the same time period in 2016. “As our largest annual sales and marketing investment, Connext generates significant momentum for us throughout the year,” says Smed. “Partners achieve a stronger understanding of where and how to identify high-potential business opportunities and then how to leverage those opportunities for the highest profitability.”
Revenue
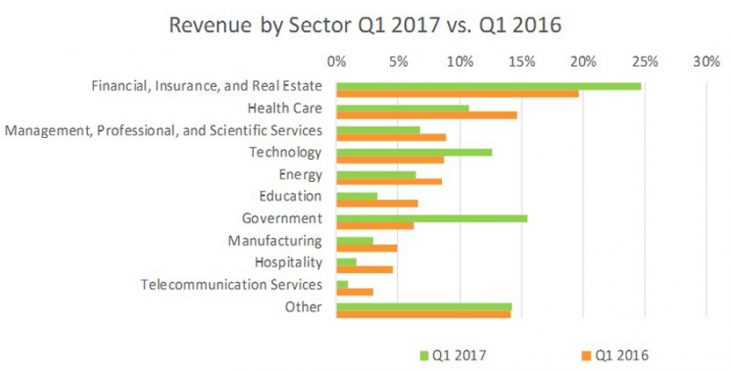
Revenue increased by $9.1 million, or 16.3%, for Q1 2017 compared with Q1 2016. This increase was achieved by a general increase in activity from small and medium-sized projects across a diverse range of industry segments including technology, which increased from 9% of total revenue in Q1 2016 to 13% in Q1 2017; and government, which increased from 6% in Q1 2016 to 16% of revenue in Q1 2017. In addition, we recorded installations revenue in Q1 2017 of $2.7 million, compared with nil in Q1 2016.
The majority of our revenue is collected in US dollars, whereas our reporting currency is Canadian dollars. As a result, we are exposed to fluctuations in the US dollar against the Canadian dollar, which could have a positive or negative impact on our revenue. The recent weakening of the US dollar, which decreased from 1.3724 in Q1 2016 to 1.3238 in Q1 2017, had a negative impact on overall revenue in the period, as compared to the same quarter in the prior year.
Below is a breakdown of the percentage of revenue by sector for Q1 2017 versus Q1 2016:
Gross Profit / Adjusted Gross Profit / Gross Profit % / Adjusted Gross Profit %
Gross profit for Q1 2017 improved to $27.0 million from $24.1 million in Q1 2016, an increase of 12.1%. However, gross profit % declined by 150 basis points to 41.5% from 43.0%. The decrease in gross profit % was due primarily to changes in product/service revenue, greater volatility in the timing of monthly and quarterly production volumes, and an increase in installations revenue which typically brings a lower gross profit than our standard manufacturing process. Volatility in manufacturing volumes is evidenced by the decline from the record revenue levels achieved in both the third and fourth quarters of 2016 ($71.5 million and $78.3 million, respectively) to the seasonally lower results achieved in the first quarter of the current year.
Adjusted gross profit for Q1 2017 improved to $27.9 million from $24.8 million for Q1 2016, an increase of 12.4%. However, adjusted gross profit % declined by 150 basis points to 42.9% from 44.4% for the same reasons discussed above with respect to gross profit.
The impact of the lower US dollar to Canadian dollar average exchange rate (Q1 2017 – 1.3238; Q1 2016 – 1.3724) contributed to partially offsetting the increased gross profit and adjusted gross profit in Q1 2017 compared with Q1 2016.
SG&A Expenses / Adjusted SG&A Expenses / SG&A % / Adjusted SG&A %
Selling, general and administrative (“SG&A”) % increased by 160 basis points from 41.4% to 43.0% in Q1 2017 compared with Q1 2016. SG&A expenses increased by $4.8 million, or 20.9%, for Q1 2017 compared with Q1 2016. The increase is reflective of DIRTT’s improved operating results in the period, as well as ongoing investment in long-term growth initiatives. The most significant change can be attributed directly to sales-related efforts as salaries and commissions increased by $2.9 million. These costs reflect the addition of personnel focused on generating and supporting higher business volumes, and commissions on the higher revenues attained in the period. Other increases in SG&A in Q1 2017 included depreciation and amortization expense of non-manufacturing-related assets of $0.7 million, travel and marketing costs of $0.5 million, professional fees of $0.2 million, rent expense of $0.2 million, and $0.5 million in other operating expense items. These increases were offset by a decrease in stock-based compensation of $0.2 million. The increase in depreciation and amortization expense of non-manufacturing-related assets correlates with the increase in our investment in leasehold improvements along with software and product development.
Adjusted SG&A % increased by 190 basis points from 34.4% to 36.3% in Q1 2017 compared with Q1 2016. Adjusted SG&A expenses increased by $4.3 million, or 22.5%, for Q1 2017 compared with Q1 2016. The reason for the increase is the same as discussed above with respect to SG&A, excluding the impact from increased non-cash depreciation and amortization of non-manufacturing-related assets and decreased stock-based compensation expense incurred in the period.
The impact of the lower US dollar to Canadian dollar average exchange rate (Q1 2017 – 1.3238; Q1 2016 – 1.3724) contributed to partially offsetting the overall increase in SG&A and adjusted SG&A expenses across the organization for Q1 2017, as certain of these SG&A expenditures are denominated in US dollars.
Adjusted EBITDA / Adjusted EBITDA %
Adjusted EBITDA decreased slightly by $0.6 million for Q1 2017 compared with Q1 2016. Adjusted EBITDA % for Q1 2017 declined by 200 basis points from 8.2% in Q1 2016 to 6.2% in Q1 2017. The decrease in Q1 2017 was mainly due to higher adjusted SG&A expenses of $4.3 million, partially offset by higher adjusted gross profit of $3.1 million and a decrease in foreign exchange loss of $0.7 million.
Gains or losses in foreign exchange (“FX”) are primarily the result of the period end revaluation of monetary assets and liabilities held within our Canadian companies. The largest component of these assets and liabilities is our holdings of US dollar cash and cash equivalents. The decrease in foreign exchange loss of $0.7 million is the result of significant fluctuations in the CAD-US exchange rate in the year-over-year periods. During Q1 2016, the US dollar decreased by $0.09 compared to year-end 2015, resulting in a $1.0 million loss on the revaluation of these monetary assets and liabilities. Conversely, the US dollar depreciated during Q1 2017 by $0.01 compared to year-end 2016, resulting in a $0.3 million loss being recognized. These amounts exclude any gains or losses resulting from the revaluation of our US dollar-denominated long-term debt, as these amounts have been re-added in the determination of Adjusted EBITDA.
Outlook
Construction is a major global industry and consists of building new structures, making additions and modifications to existing structures, as well as conducting maintenance, repair and leasehold improvements on existing structures. The total US construction market was US$1.2 trillion in 2016, of which US$700 billion was attributable to non-residential building and US$463 billion was attributable to residential building [Source: US Census Bureau]. This includes both new building and renovation projects. Total US non-residential and residential construction spending is forecast to grow to US$837 billion and US$541 billion, respectively, in 2020 [Source: FMI US Markets Construction Overview 2017]. We believe conventional construction activities are fraught with challenges including cost overruns, quality issues, labor shortages and time delays. As such, we believe organizations are increasingly seeking a better way to build out their interior spaces, whether for new buildings or renovations.
Our growth strategy consists of five key initiatives: (1) increase penetration of existing markets by providing continued support and increased investment in programs to support our existing DPs throughout North America; (2) expand into new geographies, such as the Middle East, India, Southeast Asia, United Kingdom and Europe, by capitalizing on recent and continued investment alongside new international DPs; (3) penetrate new vertical markets such as the healthcare, education and residential sectors; (4) continue investment in ICE and innovative construction solutions such as LeafTM, the EnzoTM Approach, residential interiors and timber frame construction; and (5) partner with industry leaders to monetize innovative solutions – a recent example of which is the integration of ICE with SAP’s enterprise resource planning system completed in January 2017.
We believe DIRTT solutions and the resulting more efficient and cost-effective construction experience are a superior alternative to conventional construction across all sectors of the construction industry. We also believe that a continued increase in global construction activity can result in an ongoing growth in revenue. We plan to invest additional resources in a variety of initiatives, including the continued development of ICE and new DIRTT solutions and test projects. This will lead to continued growth in the healthcare, education, government, corporate and residential sectors of the construction industry. Our product development team has been, and we expect will continue to be, expanded to address industry-specific challenges and opportunities.
The American Institute of Architects’ (“AIA”) Architecture Billings Index can be a useful leading economic indicator of how US non-residential billings activity could trend. The most recent March billings activity numbers continued to show growth nationally, building on an improving trend in February following a slower start to the year. The design activities numbers have grown nationally after being spurred by a February spike in activity. The strong readings in project inquiries and new design contracts will likely help future billings activity. Both DIRTT and the AIA believe these overall numbers point to solid fundamentals that could support growth across all segments of the building industry for the next nine to 12 months.
Liquidity and Capital Resources
At March 31, 2017, we had $90.2 million in cash and cash equivalents compared with $93.6 million at December 31, 2016.
At March 31, 2017, we also had access to an undrawn US$18.0 million revolving credit facility.
The full text of DIRTT’s 1Q17 earnings release, including all tables, and a replay of the company’s May 4 conference call, hosted by Chief Executive Officer Mogens Smed and President and Interim Chief Financial Officer Scott Jenkins, may be accessed on DIRTT’s website at www.dirtt.net/company/investor. The replay will be available until midnight (ET) Thursday, May 11, 2017 and can also be accessed by phone at +1 855.859.2056 by entering the passcode 14653038.
About DIRTT
DIRTT Environmental Solutions (Doing it Right This Time) uses its proprietary 3D software to design, manufacture and install fully customized prefabricated interiors. The Company’s customers in the corporate, government, education and healthcare sectors benefit from DIRTT’s precise design and costing; rapid lead times with the highest levels of customization and flexibility; and faster, cleaner construction.
DIRTT’s manufacturing facilities are in Phoenix, Savannah, Kelowna and Calgary. DIRTT’s team supports more than 100 Partners throughout North America, the Middle East and Asia. DIRTT trades on the Toronto Stock Exchange under the symbol “DRT.” For more information visit www.dirtt.net.


