
Let there be light//At the end of the Pandemic Tunnel


With the approval and imminent (well sort of imminent) availability of one or more vaccines juxtaposed with the worst outbreak of the pandemic so far, I’m reminded of the old proverb, “the darkest hour is just before the dawn.” One can only hope.
When contemplating a hoped-for future, it can be helpful to pause and look back at the recent past. Thanks to the most excellent work of ASID researchers, Dr. Susan Chung and Eric Lynch with the input of economist Dr. Jack Kleinhenz, that’s what we in the interior design industries have a chance to do. The association just published its most recent ASID Interior Design Billings Index (IDBI). In keeping with the times it did so via a webinar last Thursday, December 3rd.

The ”liner notes” of the Q3 ASID IDBI Report and Webinar state that, “ Beginning in November 2010, the American Society of Interior Designers (ASID) launched its business performance index. The ASID survey, conducted monthly, is designed to provide a unique perspective on current and future business conditions for the interior design industry nationally and regionally for all sizes of firms. A total of 200 firms are being invited to participate in this program. Firms included in this survey primarily are offering interior design services. While many are interior design only firms, panelists are reporting from architectural firms, engineering and other related enterprises. Panelists are asked to report on their current billings relative to the previous months and report on recent business inquires. A business sentiment question is also asked regarding how general business conditions, for the interior design industry will be six months from now. The results of the survey are compiled into diffusion indexes which are helpful indicators of changes in the direction of economic activity. The ASID indexes are centered on 50 percent (above 50 indicates expansion and below 50 contraction).”
In my opinion the indices regarding issues like current billings vs the recent past carry more weight than the business sentiment questions. For example, when this survey was done who knew the virus was planning to rise up and smack us down harder than ever, renewing more stringent precautionary protocols and causing unknowable harm to the economy. That said, there were some encouraging signs in the October report.
One thing that grabbed my attention was how quickly the industry rebounded from the depths of the March – April nadir. Taking the big dive in late March and throughout April, by May inquiries were once again in expansion mode with billings following by mid to late June (see figure 1). That indicates strong underlying demand that is temporarily disrupted by an extraneous event, with a much faster recovery than for a recession with more complex financial causes (think 2007 – 2008).

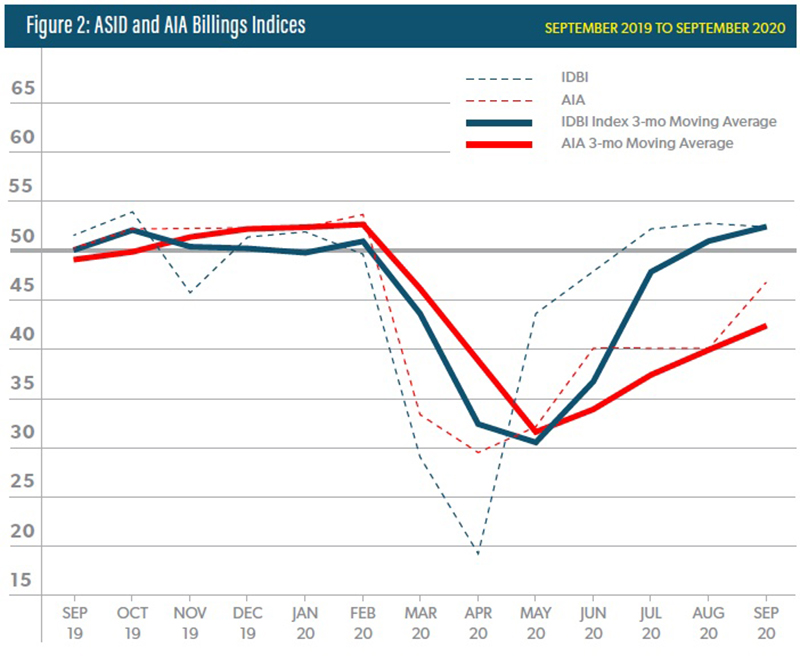
Interior Design and architecture firms are experiencing the pandemic’s impact on their businesses differently. From the ASID Report, “Architecture and interior design industries show slightly differing responses to the COVID-19 economy of 2020. While IDBI score plummeted to 19.1 in April and the corresponding index score produced by the American Institute of Architects (AIA), Architecture Billings Index (ABI), to 29.5, their rebound has differed. The IDBI score has been in positive growth territory (above 50) for the past three months while the ABI has stayed in the doldrums (below 50) since March. The September ABI score continues this trend with a reading of 47.0.” (See figure 2)
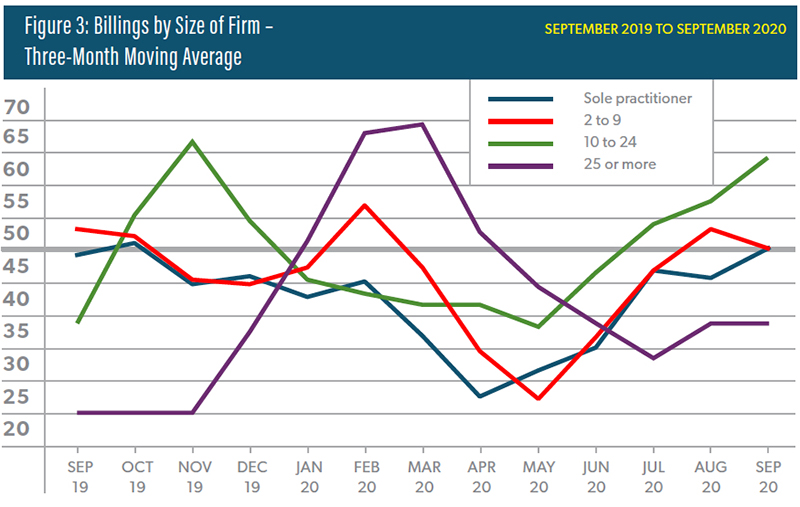
As you would expect, larger firms felt the impact later than smaller firms – likely attributable to the fact that larger firms generally work on larger projects which, once underway, grind to a halt more slowly. On the other side their recovery is lagging well behind that of smaller firm, not reaching expansion levels as of the September report. (See figure 3)
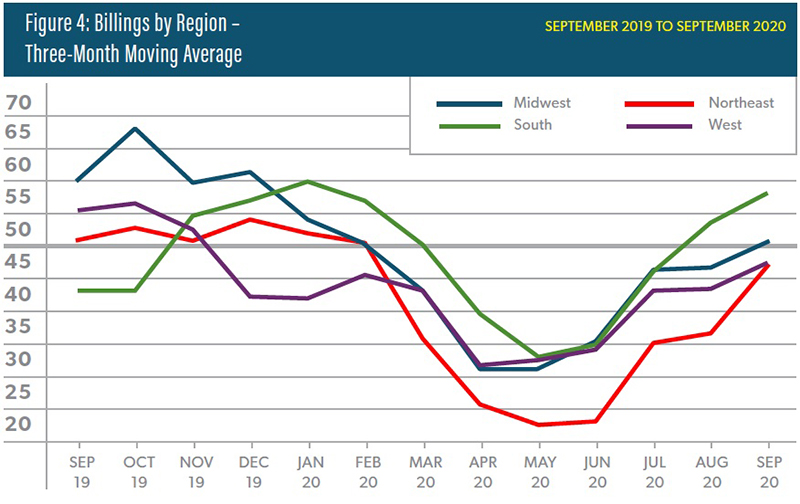
ASID breaks down the results by region. To date the South region has fared best through the pandemic – crossing into negative territory last of the four regions and going positive again first.(See figure 4)
The trends reported in the ASID IDBI are, of course, only a thread in the global economic fabric. To it’s credit ASID has brought other economic data into its report – from the Conference Board and Dodge Data & Analytics; both are highly respected sources of economic data.
According to Wikipedia, “The Conference Board produces original research, convenes conferences, and organizes executive peer-learning councils through topical Centers based in business hubs around the globe.” And Dodge Data and Analytics is the best-known source of data on the construction industry.
The ASID IDBI report characterizes the Conference Board’s findings as follows, ”The U.S. consumer confidence continued to bounce around during the third quarter. Nonetheless, they turned more confident in September, increasing to 101.8 from a revised 86.3 in August (previously 84.8) according to the Conference Board. The expectations component the Confidence Index – based on consumers’ short-term outlook for income, business, and labor market conditions – reversed slightly from 106.1 in June to 104.0 in September. Consumers are more optimistic especially about the short-term outlook. The personal savings rate is ten percentage points above its pre-COVID-19 level and provides fuel for home improvement and design services.” (See figure 7 )
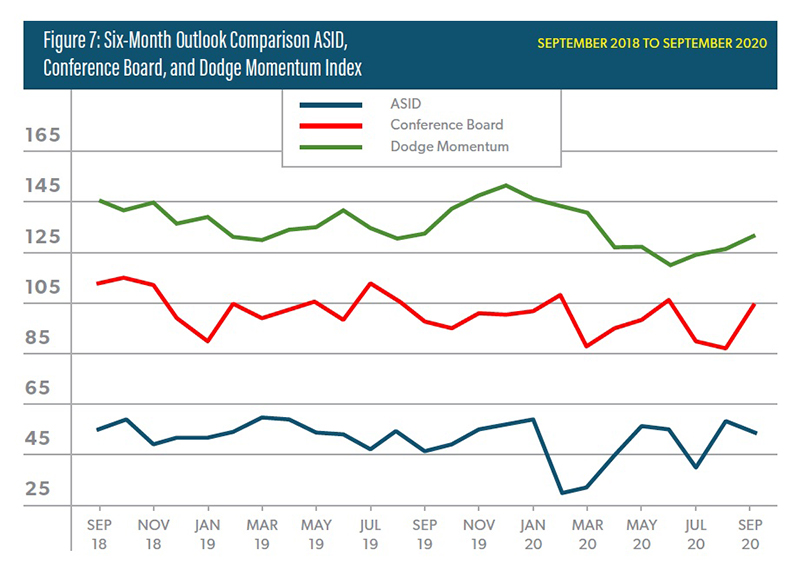
And it reports the Dodge data thus, “The Dodge Momentum Index rose in September to 130.8 (2000=100) from the June reading of 119.3. The Momentum Index is a monthly measure of the first (or initial) report for nonresidential building projects in planning, which have been shown to lead construction spending for nonresidential buildings by a full year. The Momentum Index has made steady, but slow, progress since hitting a low point in June.”
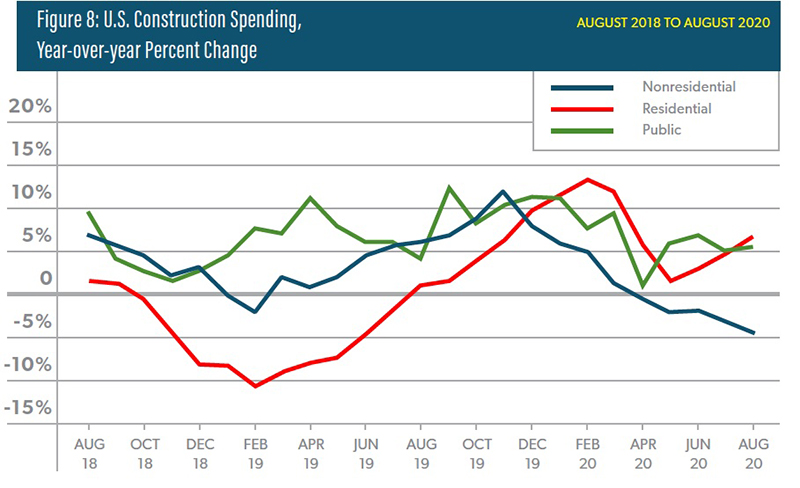
It is interesting to note that residential and public spending never crossed Dodge’s threshold into negative territory. (See figure 8)
“Collectively, these indicators suggest roughly that business conditions will continue to improve, albeit slowly and variably, as consumers and businesses perhaps look beyond the election for when a reasonably effective vaccine becomes available.”
Economic reports are necessarily backward looking and when the primary determinant of future economic activity is as fluid and capricious as an airborne virus, any solace we may get from a report whose data is three months old is to be regarded skeptically.
To my eyes the best news in the report is that business in our sector seemed to bounce back rather quickly when there was a slowdown in Covid-19 cases, and with two vaccines shining light into the tunnel, hopefully we’ll be in a position to test that resilience in the not-to-distant future.
There is a lot more in the report than I have commented on here – the summaries and conclusions of the ASID team and Dr. Kleinhenz are enlightening and comprehensive. My aim has been to pique your interest. If I’ve done my job you may download the full report here.
